
Geometry is the science of correct reasoning on incorrect figures.George Pólya
Geometer is easy to use, and since a picture is worth a thousand words, let's just start with a picture. Install Geometer on your computer, double-click the Geometer icon and you'll be ready to go.
If you own the book, "Geometry Using Computers" it contains many more examples that are completely explained, and it thus would serve as a more advanced tutorial. There is also a Teacher's Tutorial in this collection but it is quite advanced. If you have problems starting the program (the window is too big for your screen, the colors are strange, the font is too small to read, et cetera) there are preferences that can be changed. See the section on startup preferences.
The first example will illustrate a standard theorem from high school geometry---the fact that the three medians of any triangle all meet at a point, or as a geometer would say, the three medians are "concurrent".
(In what follows, we assume that you know how to use a mouse and keyboard, how to use pull-down menus, how to start programs, how to use a simple cut-and-paste text editor, et cetera. If not, get your kid to help you.)
Run the Geometer program by double-clicking the icon. The window that appears has three sections: a large black work area, a pull-down menu across the top, and a command area on the right side of the screen that's filled with buttons and other controls. See the figure above.
If you have just installed Geometer, there will also be a "Tip of the day" that you can dismiss for now by clicking on its "Close" button. Under the File entry in the pull-down menu, select Open. A file selection dialog box will appear, and use that to double-click on the directory Demos and then double click on Medians.T to open that file.
See File Chooser for details on how to use the file chooser.

You should see a large triangle ΔABC as shown in the figure above. Use the mouse to move the cursor over one of the points labeled A, B, or C, press the left mouse button, and hold it down as you move the mouse around. The point will be dragged by the mouse, and the whole figure will change in response. Note that the three lines inside the triangle continue to cross at the same point.
So what's going on?
This example illustrates an important theorem in Euclidean geometry---that the three medians of a triangle meet at a point. A median is a line that connects a vertex of a triangle to the midpoint of the opposite side. The medians in this example are the line segments connecting A to Am, B to Bm, and C to Cm. (Am is halfway between B and C, Bm is halfway between A and C, and so on.)
Now try dragging a vertex again and watch what happens a bit more closely---as you move the vertex A, B, or C, the points Am, Bm, and Cm move in such a way that they remain exactly in the middle of each side.
As you drag the vertices of the triangle around, you are effectively testing the theorem for thousands of possible triangles, and although this is not a proof of the theorem, at least it provides a lot of evidence that the theorem may be true. When the author was showing a very early version of Geometer to a friend, she asked if it were a "theorem prover". The answer, of course, is no. It's a "theorem convincer". Click here to learn why it is not a theorem prover.
But the thousands of Geometer diagrams are certainly better than what you get in a typical textbook or what you can do with paper and pencil. If you only look at a single illustration in a textbook, how do you know that the person who drew it wasn't simply lucky, and for the particular triangle drawn, the three medians do happen to coincide? After all, if you only look at a diagram of an equilateral triangle, a "theorem" that states that all medians of a triangle are also angle bisectors of that triangle appears to be true.
Finally notice that the only points you can move are A, B, and C; you can't move the medians Am, Bm or Cm (although they do get highlighted when you click on them---more on that later), or the point at the intersection of all three medians. Some points are free, others are constrained, and as we'll see later, some are partially constrained.
All the diagrams that appear in this tutorial and in the associated documentation were created with Geometer and the vast majority of them can be manipulated in exactly the same way you manipulated the medians in the example above. Some of them allow even more manipulation options.
Before trying to create your own Geometer diagrams, you may wish to view a few of the prepackaged demonstrations. In fact, for many people, the best way to learn what Geometer does will be to try lots and lots of the diagrams. When you see something that you don't understand, you can look at the text version, or if that doesn't work, you can break down and look at the reference manual. We'll look at one canned demonstration, but you can get a better idea of Geometer's capabilities by loading a bunch of other diagrams and playing with them.
The text on the screen tells you that for any triangle, the midpoints of the sides, the feet of the altitudes, and the points half-way between the orthocenter and the vertices of the triangle all lie on a single circle. (The orthocenter is the point where the three altitudes of the triangle meet.)
It would be tough to visualize this without some sort of drawing, and every geometry book in which the theorem appears will have a drawing showing you what's going on.

Similarly, Geometer's diagram above illustrates one example. The altitudes are the perpendiculars to the sides that pass through the vertices opposite. In the Geometer diagram, they are drawn in red. The points E, F, and G at the feet of the altitudes are labeled in red as well. The midpoints of the sides are labeled in yellow, and the points midway between the intersection of the altitudes at H and the vertices are labeled in green. All nine points lie on the magenta circle.
Mouse down on the vertices A, B, or C, and move them around. The triangle can change shape, perhaps drastically, and the magenta circle will change size and position as well, but by golly, those nine points will stay on that circle. They may change their ordering on the circle, and the altitudes may meet outside the triangle and their feet may lie outside as well, but no matter how you move the triangle's vertices, those nine points remain locked on a circle.
This is a nice demonstration, and the more playing you do with the diagram, the more convinced you will become that the theorem is true. But you have not seen a proof. For all you know, you didn't manage to find some configuration of the vertices that cause the points not to lie on a circle, and in reality, your eyes (and computer calculations) are only so good. The true points may lie a millionth of a centimeter off the true circle.
Warning: if you're a bit rusty at geometry (which is a likely reason that you're using Geometer), don't worry if you can't follow the following proof---it depends on knowing a few facts from elementary geometry. This theorem was chosen, however, because it is pretty amazing, and the proof requires a few steps (but not too many). Even if you aren't rusty, you'll still have to think---just not quite as hard as you'd have to if you were staring at a single static figure in a high school geometry textbook.
To step through a proof of the theorem, move your mouse to the lower right part of the command area on the right side of the window, and click on the button that says: Next. This advances one step into the proof. The next step of the proof usually changes both the diagram and the textual description under that diagram.
At each stage in the proof, there's usually a bit of text to explain what's going on, and the diagram changes somewhat. In the first stage of the proof of the nine-point property, you will simply be convinced that a particular pair of lines is parallel and that the lines are the same length. The lines in question are emphasized with a blinking color, and the text gives the geometric reasons why they must be the same length.
As you step through the proof, at any point you can manipulate the figure. While you're looking at this first step of the proof, try moving the points A, B, and C, and notice that although they move around, the blinking lines remain parallel, and that they remain the same length. (You'll also notice that not only do the lines stay parallel, but their endpoints seem to form a rectangle---a fact that will be proven later on.) It is interesting to note that one blinking line is not necessarily always above the other, as you can verify by moving the triangle's vertices. Thus if the proof had depended on the fact that C'A' was above QR, it would obviously be incorrect.
Once you're convinced of the first step of the proof, press Next again to continue. Read the statement that appears, and convince yourself that it is also true. Then simply repeat this process all the way to the end. You can back up to a previous step in the proof using the Prev button, or you can start over at the beginning of the proof with the Start button.
Feel free to poke around and look at the other files in the various subdirectories to get an idea of the sorts of things that Geometer can do. Remember that all of them were created with Geometer itself, so you can learn to do the same.
To get a good overview of the features, here is a recommended set of diagram files to examine. Don't worry if you don't understand exactly what's going on---just observe the sorts of things that Geometer can do for you. The rest of this book is to help you understand why these things work.
If you get bored and want to stop a running script, click on anywhere in the black drawing area. To clear the drawing area, click there again.
OK, now that you know what Geometer can do, let's try to create a theorem ourselves. A nice exercise is to recreate the first example we saw in the introduction illustrating the fact that the three medians of a triangle meet in a point.
Get rid of anything on your screen using the New command under the File pulldown menu. Depending on what you did, you may have to agree to throw away your changes. Agree to anything, and after you do, you've got a clear drawing area.
First, create the three vertices of the triangle. To do this, find the Free P button near the upper left of the command area. Click on the little square to its left, and then move your cursor into the drawing area an click down where you want the first vertex to appear. Do the same thing (click on the little square, then in the drawing area) twice more, and you'll have the three vertices of your triangle. By default, Geometer labels the first free points that you make as A, B, C, ... If you don't like these names, they can be changed later. For now, just leave them the way they are. The points are called "Free" in that they don't depend on anything. You can freely move them with your mouse.
Note: 99% of the time, the first thing you will do when you begin a new Geometer diagram is to create some points. All the other primitives (lines, circles, et cetera) are defined in terms of points, so if you don't have a point or two, there is almost nothing you can do.
Now if you don't like the positions where you put them down, you can move them with the mouse, exactly as you did in the previous canned examples. Move them around until they form a triangle that you find satisfying.
Next you need to make the edges of the triangle. At the upper right of the command menu is a button labeled PP=>L. It's under the Line area, so it'll create a new line, and the name indicates how: two points will determine a line. Click on that button, and then click on two different points to make the first edge of the triangle.
Do exactly the same thing to make the other two edges, but as you make them, notice what's going on in the little text window near the bottom of the command menu. When you start, you're in "Manipulation Mode" (meaning that you can manipulate the points in the diagram by clicking on them), but as soon as you click on the PP=>L button, it changes to say "Pick Point 1". After you've successfully clicked on the first point, it'll change again to "Pick Point 2". When the line has been successfully completed, the message changes back to "Manipulation Mode". It's obvious what's going on in this simple example, but in more complicated situations, it's nice to be able to look there and see exactly what Geometer expects. It can even be a help in simple situations. Suppose you want to make a point where a circle intersects a line, so you issue the appropriate command, and click on the circle, but then Geometer won't seem to let you click on the line. Then you look in the little box, and it says "Pick Circle". This might happen because you got sloppy and didn't click close enough to the circle for Geometer to know which one you meant.
After you've got the three points and three edges connecting them (or at any point in between), you can move the points around as long as you're not in the middle of specifying a line. (In other words, when you're in "Manipulation Mode" you can always manipulate the points.
Now we need to construct the midpoints of the sides. This can be done with a standard straight-edge and compass construction, but it's such a common operation that Geometer provides a shortcut; in this case, the PP=>P Mid command. This makes a new point that's the midpoint between two other points.
Since you're probably lazy (but probably not as lazy as the author), you're already tired of going to the command menu, clicking on a command, and then clicking to enter a new geometric object. Geometer provides a short cut, called "Repeat Mode" where you can repeatedly add the same type of object. Let's try it to make all three midpoints.
Instead of simply clicking on the PP=>P Mid button, double-click it or hold down the Ctrl key on your keyboard before clicking on the button. Note that the little light goes on in the "Cancel Repeat Mode" button at the bottom of the command menu. In repeat mode, click on all three pairs of points, and each time to do so, you'll get another midpoint. After the third one, you don't want to continue making midpoints, so click on the "Cancel Repeat Mode" button to get yourself out of repeat mode. The keyboard shortcut for "Cancel Repeat Mode" is Ctrl-g (in other words, hold down the Ctrl key while you type g).
Note: You can also get out of repeat mode simply by clicking on another command button. If you just click on a new button, you'll be able to make one of those objects. If you double-click or hold down the Ctrl key when you click on the new button, you'll be in repeat mode for the new command.
Now finish the theorem illustration by putting in the medians---the lines connecting the vertices of the original triangle with the midpoints of the opposite sides. For this you'll use the PP=>L command again, and the lazy ones among us will double-click (or use the Ctrl button) to do it in repeat mode.
Get out of repeat mode if you're in it, and you can illustrate the theorem by moving the vertices of the newly created triangle and noting that the three medians always seem to meet in a point.
Finally, let's add some text to the diagram to indicate what it shows. Under the Primitives pull-down menu, select the Text->Descriptive Text command. A little window appears that supports a very simple editor. Type in a description, something like: Three medians meet at the centroid, and then click on the Save button. Your text will appear in the lower left of the drawing area. You can edit this text if you wish by clicking on it (it will be underlined when selected), and then use the Edit Text command in the Edit pull-down menu. The text can have multiple lines, but can only be 1000 characters long.
OK, the medians theorem is pretty easy, and you've probably seen it before, so let's get a little more practice with Geometer and at the same time learn an interesting fact about Euclidean geometry.
In the File pulldown menu, select New and your Geometer work area will be cleared (again, after you agree to throw away your changes).
Geometer's most important editing commands appear in the command area on the right side of your screen. At the top of that area are most of the geometric creation commands. Each command has a little square to its left, and clicking on that square will allow you to create a geometric object. The commands are arranged by what they produce---all the point creation commands are in one group, and all the line creation commands in another.
Make two free points in the drawing area, and try to put the first of them roughly in the center of the drawing area and the other toward the middle of the right edge. You're going to use the centered one as the center of a circle and the other as a point on its edge.
Now click the square button next to Ctr PP=>C under the label Circle. This command works like a physical compass in that you need to set the distance between the point and the pencil and identify where the point goes before you draw a circle. You're going to make a circle by choosing a point for its center and then setting the radius by identifying two points whose separation is the radius that you desire. Note that in the status window near the bottom of the command area, the text reads "Pick Center Point"---remember that you can always look in this status box to get some idea of what Geometer wants you to do next. In this case, you need to click on the point that you want to use as the center of the circle, so click on the point labeled "A" near the center of your window.
Now you need to pick two points whose distance apart is the radius. These will be A and B. The status window now reads "Pick Reference Point 1", so click on the point labeled A and then on point B and a circle will appear. Try moving the two free points and note that the circle changes in such a way that its center is always point A and point B always lies on its edge.
The Ctr PP=>C command is the most useful one for making circles. Quite often, however, the situation is what we had above---one point (A) is the center and the other (B) is on the edge of the circle. To use the command, you need to pick A, then A, then B. There is a shortcut: Ctr Edg=>P that allows you to pick the center and then a point on the edge so that drawing this common type of circle is a bit faster, but be sure to remember the most powerful method: Ctr PP=>C.
Now use the P on C (point on circle) command under the label Point and click anywhere on the edge of your circle. A new point (labeled "C") will be created there. Try to move this point with the mouse, and note that it is constrained to stay on the edge of the circle, but otherwise can move freely. Connect points A and B with a line (using the PP=>L command) and finally, use the command PP=>P Mid (also under Point) and pick point B and then the point C which is the other point on the edge of the circle. This command creates a point that will always be the midpoint between the two points.

At this point, you should have a drawing that looks something like what is illustrated in the figure above.
Now let's learn some geometry. Click down on the point that's constrained to be on the edge of the circle (the one labeled C---not the one labeled B), and move the mouse around and around the circle, watching what happens to the midpoint. Notice that the midpoint seems to go around also, and seems to sweep out a circle of its own.
We can make this even more obvious by clicking on the midpoint to select it (notice that when selected, it is displayed with bolder lines). Then, using the Color selector button in the command area, change the color to Smear and the midpoint's color will change to a medium shade of gray.
Click down on the point labeled C constrained to be on the edge and move it around the circle again. This time, the midpoint will smear and you can see that all its valid positions seem to lie on a smaller circle passing through points A and B. You should get a picture something like that in the figure below.

Let's try a couple of other things---click on the PP=>P Mid command and create a new midpoint between your smearing midpoint (the one called "D") and the point constrained to the circle's edge (point "C"). Make that have the smear color as well, and again move the circle-constrained point around. Both midpoints sweep out circles, but the new one is 3/4 the size of the original circle.
Does it matter that the fixed point is on the circle? Can you construct a Geometer diagram where the other end of the segment is not B on the circle's boundary, but is somewhere else, either inside or outside the circle? What is the general situation? Can you figure out why?
OK. Your drawing is pretty boring---except for the smearing, it's all one color, and you only used a few different commands to make it. Feel free to play around with the other commands to see what you can figure out. You can't get into serious trouble, and the only recommendation is to avoid the Edit Geometry command in the Edit pull-down menu. The Rpt Set Color button may be a little mysterious as well.
One of the most useful commands is found under the Edit pulldown menu---Edit Name (This is such a commonly used command that you can also access it with Ctrl-n---hold down the Ctrl key while you type an "n"). Select a point or a line in your drawing by clicking on it and issue the Edit Name command. A little box pops up with the old name (if it had one), and you can edit it or type in a completely new name. (If it has a name that you want to get rid of, just backspace away the name when the dialog box comes up. The point or line will then be unlabeled.)
Although only certain primitives display their names on the screen (points, lines, angles, and something called "flts" which will be discussed later), you can name anything, and this is sometimes useful because the Describe Geometry command will use this name when it tells you what's selected. If you don't give something a name, Geometer will make up a name for you, and Geometer is not very imaginative. Its point names all look like A, B, ..., Z, a, b, ..., z, 1, 2, 3, 4, ...
Click on things to select them, and try changing their colors, point types, and so on. Obviously, you can't change the point type of a line, or the angle type of a point, but most commands make sense.
Basically the name on every button in the upper part of the command area includes an indication of what it makes, and what's required to make it. The basic primitives that you can make include points, lines, circles, polygons, angles, and conic sections. The command CC=>P says that two circles are required to make a point at their intersection. A lot of the commands do the "obvious" thing: PP=>L gives a line passing through two points, LC=>P gives the point at the intersection of a line and a circle (which you must click on in that order---line first, then circle), et cetera.
Sometimes there's additional information. We saw the "Mid" in PP=>P Mid that found a point that's the midpoint of two others; PL=>L Perp generates a line that's perpendicular to a line and passes through a point, and CC=>Ext Tan yields a line (it's in the Line section) which is the external tangent to two circles.
Let's take a slightly closer look at the CC=>P command which makes a point at the intersection of two circles. But which one? Circles usually intersect in either two places or none. How does this command work? Try it out, or look ahead in the Basic Reference Manual where all the commands are completely described to learn the details.
Keep in mind that while you're fiddling with commands, you can always look in the little command feedback window to see what Geometer needs next. (Even then, you can get into trouble. For example, if you've got four points in your drawing and you click on the 5P=>Con command, you will then need to select 5 different points. You can click on the first four with no problems, but Geometer will keep asking you to "Pick Point 5" no matter what you do, since it insists on having different points for that particular command. Geometer is currently too stupid to look ahead to make sure there's enough stuff defined to allow a command to succeed, so if you get stuck, you can simply click on a new command in the middle of trying to execute the impossible command to abort it.)
If you start a new drawing using the New command in the File pulldown menu, it's almost certain that the first commands you'll issue will be a few Free P commands. All the others require some geometry to be there already (a line needs two points to connect, a circle needs a center and an edge, or three points on its outline, et cetera). Similarly, before you can issue the LC=>P command (that makes a new point at the intersection of a line and a circle), you'd better have a line and a circle on the screen. If they don't intersect, that's fine---try making a circle and a line that doesn't go through it, issue the LC=>P command and click on the line and circle as you are asked for them. No point appears, but as you move the line across the circle (or the circle across the line, of course), the new point will suddenly appear. Now, for fun, connect that "ephemeral" point with another to make a line. As you move the original circle and line to make them intersect or not, both the ephemeral point and the line based on it will appear and disappear. This may seem strange, but trust me---this is a good thing!
Another "good thing" that may seem disturbing at first is that Geometer considers every line to be infinitely long, even though it may be displayed as a short segment (the line type can be "segment", "ray", or "line"). If the extension of the segment hits the circle, you'll get the point at the intersection. Geometer does try to avoid selecting a line except when you click on a drawn part of it, however. Make a line between two points that's of line-type "Segment" and click near it to see where it's sensitive to selection. Then change it to Line Type "line" and notice that you no longer need to click between the two points to select it.
If you're short on ideas to try, here's something. Make a demonstration of the fact that the three altitudes of a triangle also meet in a point. An altitude is a line that drops from a point perpendicularly to the opposite side of the triangle. You'll probably want to use the command, PL=>L Perp. It takes a point and a line, and constructs the line through the point and perpendicular to the line.
Or just see what you can do in the way of generating geometric art by making some constrained linkage with some of the moving parts drawn in the "Smear" color.
Before we go on to cover more of the common commands, here's one more thing you should try. Make some sort of simple drawing that includes at least a few lines and points, and for fun, change the colors of a couple of them---in fact, make the first point you create red (it should have the name "A" if you started with the New command). Don't make things too complicated either---include at most a dozen objects so it's easy to see what's going on.
You're going to edit the textual version of your diagram. This is more "exciting" in the sense that you'll now have an opportunity to really foul things up, but remember that if you get into trouble, you can always delete all the text in the file and save the empty file, and you'll at least be back to an empty drawing.
Under the Edit pulldown menu, select the Edit Geometry command. A small text editor window will appear that contains some strange-looking text. Take a look at it---it's just a textual description of the drawing.
Assuming you used the buttons from the command menu, every line (except for the first that contains Geometer version information) represents an object on the screen. Your red point named "A" will have an entry (probably on the second line of the file) that looks like this:
 v1 = .free(-0.420784, 0.212947, .red,
"A");
The numbers represent the current coordinates on the screen, so the ones in the example line above will be different from yours, but the rest should look about the same. "v1" is the internal name of the point, ".free" says that it is a free (unconstrained) point that you can move with your mouse, the coordinates tell where it is in the x and y directions (the initial screen runs roughly from -1.0 to 1.0 in both dimensions), the ".red" tells the color, and the ""A"" says that the point is to be displayed on the screen using the name "A".
Now, using the editor (it's a simple, mouse-based, cut-and-paste editor with nothing fancy about it), change the line to look as follows, with the ".red" changed to ".magenta", the name "A" changed to "Fred", and both of the coordinates are changed to 0:
v1 = .free(0,0, .magenta, "Fred");
Use the Save command in the editor's File pulldown menu and the results will appear on the screen. The new point will be colored magenta, it'll be labeled "Fred" instead of "A", and it will appear in the exact center of the drawing area, since you changed its coordinates to x=0 and y=0.
Other than that, everything is exactly as it was, and you can still click on the "Fred" point and move it around. After moving it, issue the Edit Geometry command and you'll see that your changes are still represented---the point will still be called "Fred" and it will still be magenta, but (since you moved it), the coordinates will probably no longer be 0 and 0.
Let's try a couple of other things with the editor before we continue with Geometer's basic features. Edit the geometry again (using the Edit Geometry command in the Edit pulldown) and add a name to one of your lines as follows. Suppose the line description originally looked like this:
l1 = .l.vv(v2, v1);
Change it to this:
l1 = .l.vv(v2, v1, "Line");
Finally, add an entirely new line like this to the end of the file:
.text("Here's some displayed text.", .green);
(Be sure to get all the punctuation right, including the periods in the initial ".text" and the ".green".)
When you save the file, the line will have the name "Line" next to it, and "Here's some displayed text." will appear in green on the left of your window's drawing area.
If you make a typing error, Geometer is pretty stupid about figuring out exactly what's wrong, but it'll give you some clue in an alert window, and will then return you to the editor with the first bad line highlighted. Or at least what it thinks is the bad line---it may be reading the next line before it notices that you've left something out of the previous. If this happens, find the error, fix it, and save again. If you've been doing a lot of editing and have made a lot of errors, Geometer will only find one at a time, and will keep popping up that editor window until you've fixed them all.
If you really foul things up and you just want to bail out to the situation before you tried to edit the file, use the Quit command in the pulldown menu.

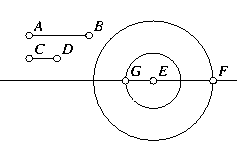
We would like a diagram like that in the figure above but without those extra circles. The diagram contains the three segments in the upper left whose lengths we can adjust with the mouse, and the resulting triangle is displayed below. If we can get a diagram like the one displayed, we can simply make all the circles the invisible color and we will have exactly what we want.
To make the drawing in the figure, first create six points to control the lengths AB, CD and EF of the sides of the desired triangle. Connect them with line segments if you wish. Next, create an arbitrary free point in the drawing area (which is called G in the figure) to be one point of our final triangle. If we draw a circle around G with radius equal to AB, then we can pick any point on that circle (H in the diagram) and that point will be a distance AB from G. In other words, GH=AB. This is a good way to copy a distance.
To draw the circle, use the Ctr PP=> command. Pick G as the center and then pick A and B as the two reference points. The circle drawn will thus have center G and radius equal to the distance between the reference points, or AB in this case.
Next, use the P on C command and click anywhere on the circle to create H. Connect G and H with PP=>L.
Now create circles about G and H with radii CD and EF, exactly as we just did. At the point of intersection of these circles must lie the third point of the triangle, since it will thus be CD away from G and EF away from H. To find the intersection of two circles use the CC=>P command. This will create point I which we then connect to points G and H to complete our triangle.
We can now adjust the lengths of the segments by moving the points A, B, ..., F.
The second example is even easier, especially if you have just seen the previous example. The problem is this: construct a Geometer diagram where you can adjust the lengths of two segments and the diagram will display a new segment whose length is the sum of the lengths of those two. It will look something like the previous example, but with only two adjustable segments above, and one final segment as the result as displayed in the figure above.
The solution is quite simple. Begin as you did before by making two segments AB and CD with four free points. You will be able to adjust these lengths in the final diagram. Next, create a free point in the drawing area and make two circles around it of radii AB and CD. Choose F on one of the circles, draw a line through F and E, and (using LC=>P) find the intersection of that line with the other circle at the point G.
Clearly GF is the required segment. The length EF is the same as AB and EG is the same as CD. But GF = GE + EF, so we are done.

Here is the problem: Given three lengths, construct a set of three circles that are mutually tangent and have those three lengths as their radii. In the figure above you can adjust the three lengths by moving the points labeled A2, B2 and C2 at the top of the diagram. As you do so, the three circles change size appropriately to maintain their tangency.
Without reading further, try to make this drawing. As a hint, think about where the centers of those circles must be. It may also be a good idea to load the Geometer file corresponding to this figure and play with it a bit to see exactly what you are trying to draw. The file is in Demos/TangentCircs.T
The solution can be viewed in: Tangent Circles Solution.