Introduction to Geometer
Here are some things to try after you have installed Geometer for the first time.
Demo Programs
 Double-click on the Geometer icon and dismiss the "Tip of the Day" message by clicking the "Close" button. Enlarge the window if it's too small. Windows Users: If Geometer produces a garbled, unreadable window when it starts, click here.
- Under the "File" menu, select "Open" and double-click on the "Demos" entry. Any file there is interesting. Click here for a short description of each that you can read as you try the demos. In many of the demos, you can move some of the points by clicking on them with the mouse and dragging them. Try this in the demo called "cvvvvv.T".
If for some reason Geometer's "Open" command can't find the Demos directory, it will be in the installation directory (/Applications/Geometer on a Mac, or in C:\Program Files\Geometer on a PC). You can just double-click on the demo files there or drag and drop them onto the Geometer icon.
Creating a simple Geometer diagram
We will create a diagram that illustrates Miquel's theorem. If this is your first time, please follow along carefully!
Most of Geometer's commands for creating geometry are in the panel to the right of the geometry window. They create points, lines, circles and so on. Many of them are labeled something like "LL=>P" which can be interpreted as "click on two lines to create a point". In this case, the point is at the intersection of the lines. In the panel, the commands are sorted by what they create.
- Under the "File" menu, select "New".
- Click in the box next to "Free P" and then click somewhere in the geometry area to create a point that is automatically labeled "A". (The "Free" means the point is free of constraints and can go or move anywhere.)
- Repeat the sequence above twice more to create additional points labeled "B" and "C".
- Now we will connect all three pairs of points to make a triangle. Click on the box next to "PP=>L" which means to make a line from two points. Notice that near the bottom of the control panel is a text area where Geometer tells you what it needs: in this case, "Pick Point 1". Click on point "A" and the message changes to "Pick Point 2". When you click point "B", the message returns to "Manipulation Mode" and a line segment AB is drawn between points A and B.
- Repeat the process above twice more to create line segments BC and CA completing triangle ABC.
- It is annoying to have to return to the panel each time to select the item to be created. What we want to do now is to create points that lie on each of the triangle's three sides which we will do with the command "P on L" (point on line). This time, though, double-click the box next to "P on L" and note that a little yellow mark appears on the left of the "Cancel Repeat Mode" button below the message that tells you what to do next.
You are now in repeat mode, and each time you click on a line, a new point will be created on it. Click once on each line to create points on segments AB, BC and CA.
- Click on the "Cancel Repeat Mode" button to stop the "point on line" creation and the yellow rectangle disappears. You can also click on any other command to get out of repeat mode, or you can double-click another command to get immediately into repeat mode for that new command.
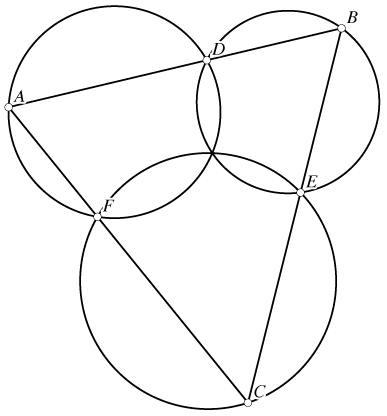
- Finally, we are going to create three circles using the "PPP=>C" command which creates the unique circle passing through three points. Double-click that command's box and make three circles. Each one consists of a single triangle vertex (A, B or C in your diagram) and the two points on the segments that touch that vertex as in the diagram below. For example, to create the circle passing through the three points A, D and F, click on those three points.
- Get out of repeat mode by clicking on the "Cancel Repeat Mode" button.
- Notice that in the diagram above and in your Geometer diagram, the three circles meet at a single point. Is this luck? You can see that it isn't by clicking down on any of your vertices A, B, C, D, E or F and dragging them around. This result is called "Miquel's theorem".
- Congratulations! You have created your first Geometer diagram. If you like, you can save it (with a name like "Miquel.T") using the "Save" command under the "File" pulldown menu.
What next?
The exercises above should give you an idea of Geometer's power. You can just play with the program if you want, but here are some other suggestions for how to learn more:
- Under Geometer's "Help" pulldown, there is a much more extensive Tutorial. If you don't like the browser that Geometer uses, just go to the installation folder and in the sub-folder called "HTML", double-click on the "Tutorial.html" file.
- A much more extensive tutorial that is aimed at users with a bit of experience can be found here and also in the file "Teachers.html" in the HTML folder in your installation directory.
- Also under the "Help" menu (and also available in the same "HTML" directory) is complete documentation and a reference manual. An easier to read manual (in PDF, or Acrobat format) is in the "Reference" folder.
- There is a complete intermediate geometry textbook (in PDF, or Acrobat format) based on Geometer in the "GeomBook" folder in your installation directory. All of the figures in that book are available in that directory and can be loaded and manipulated with Geometer.
- If you just want to play around, there are many hundreds of example Geometer files in the various directories in the installation directory.
- Have fun! I'm interested in feedback of any sort, especially bugs. Send me email at: tomrdavis@earthlink.net.
Return to the Geometer home page.